


YouTube - Summary - Notes - Playlist - Vector Functions playlist
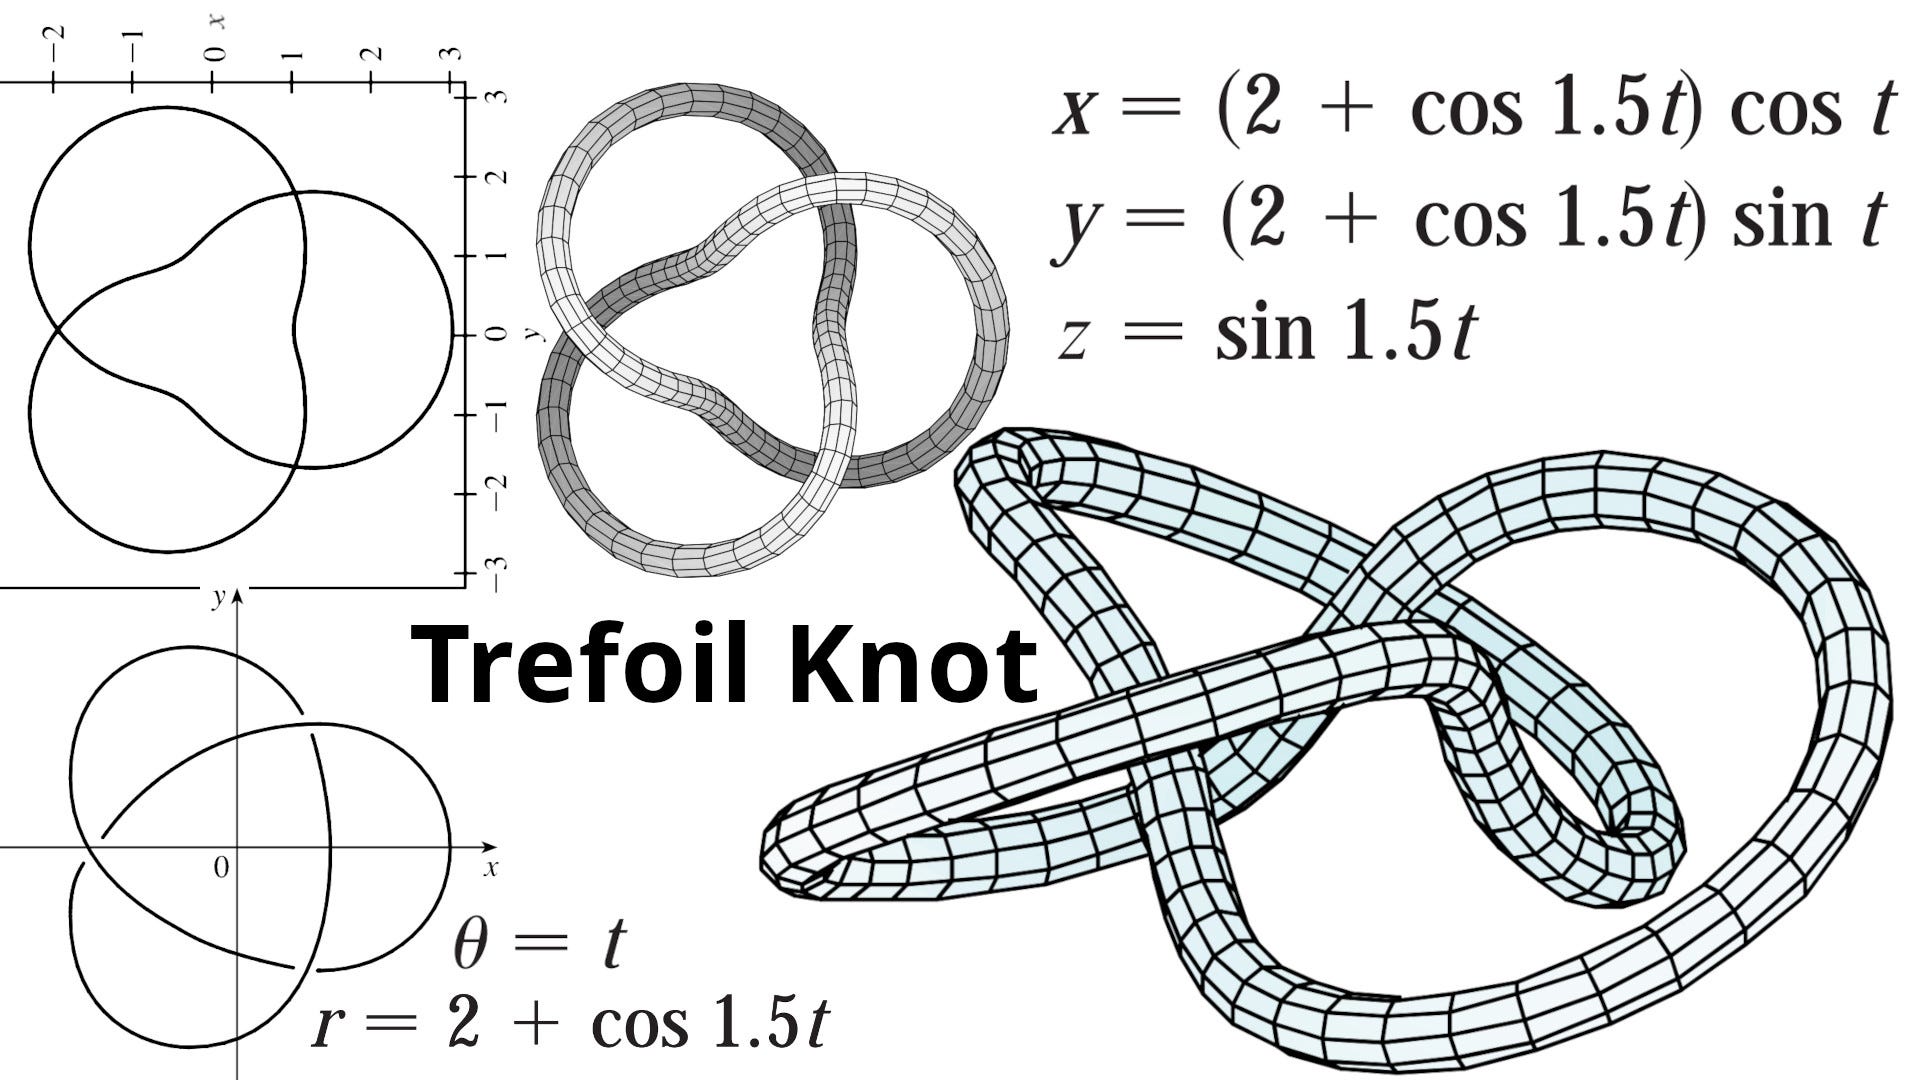
In this video I manually (and painstakingly) plot an approximation of the projection of the 3D trefoil knot onto the xy-plane. I begin by converting the parametric equations of the trefoil knot into polar coordinates, and then find the values where it is max and minimum until the projection repeats itself. I then determine the min and max of the z values, and use this to determine where the projection overlaps at each intersection point. I then compare my manual graph with the computer-drawn one, and my approximation leaves out the 3 inflection points. I also plot the trefoil knot in 3D using the amazing GeoGebra graphing calculator as well as the new Desmos' graphing calculator.
#math #trefoilknot #geogebra #desmos #calculus
Timestamps
Exercise 3: Trefoil Knot: 0:00
Solution: Projection of the curve onto the xy-plane: 2:41
Converting to polar coordinates: 3:27
Polar equation for the projection onto the xy-plane: 10:37
Obtaining minimum and maximum values of r for various angles until we rotate back to the starting point: 11:11
Manually graphing an approximate projection on the xy-plane: 23:09
Determining how the curve overlaps by finding the minimum and maximum values of z. Initially finding max values: 28:52
Minimum values for z: 35:45
Minimum and maximum values for z occurs at r = 2: 38:50
Comparing max and min values of z at intersection points to determine overlap: 41:06
Computer-drawn graphs of the Trefoil knot and its projection, which has inflection points: 45:39
Graphing the trefoil knot in GeoGebra: GeoGebra 48:15
Using Grok AI to plot a tube around the trefoil knot: Grok AI Plot 48:35
Plotting in Desmos' new 3D graphing calculator: Desmos 3D 49:41


Share this post